> ## Documentation Index
> Fetch the complete documentation index at: https://lightdash-mintlify-653dc026.mintlify.site/llms.txt
> Use this file to discover all available pages before exploring further.
# Using custom fields
> The fields that you see in your `dimensions` and `metrics` are created by the people maintaining your Lightdash project. But, you can create new custom dimensions or metrics for quick calculations and binning on the fly. On this page, we'll explain what custom dimensions and metrics are and how to use them.
## Custom metrics
Custom metrics are only saved in the chart they're used in and will not be saved in the list of `metrics` available if you open the same Table to build a new chart. Metrics written to your dbt project (or YAML metrics) are reusable by everyone in your project and will always show up in the side bar of available metrics for a Table. We recommend [writing back custom metrics](/guides/developer/dbt-write-back#write-back-metrics-from-custom-metrics) that you're using/creating frequently so they become reusable, governed and available for everyone else to build from.
To create a custom metric:
1. Click on the dimension's three-dot `options` menu
2. Click on one of the options available (e.g. `Count Distinct`)
3. Confirm your changes
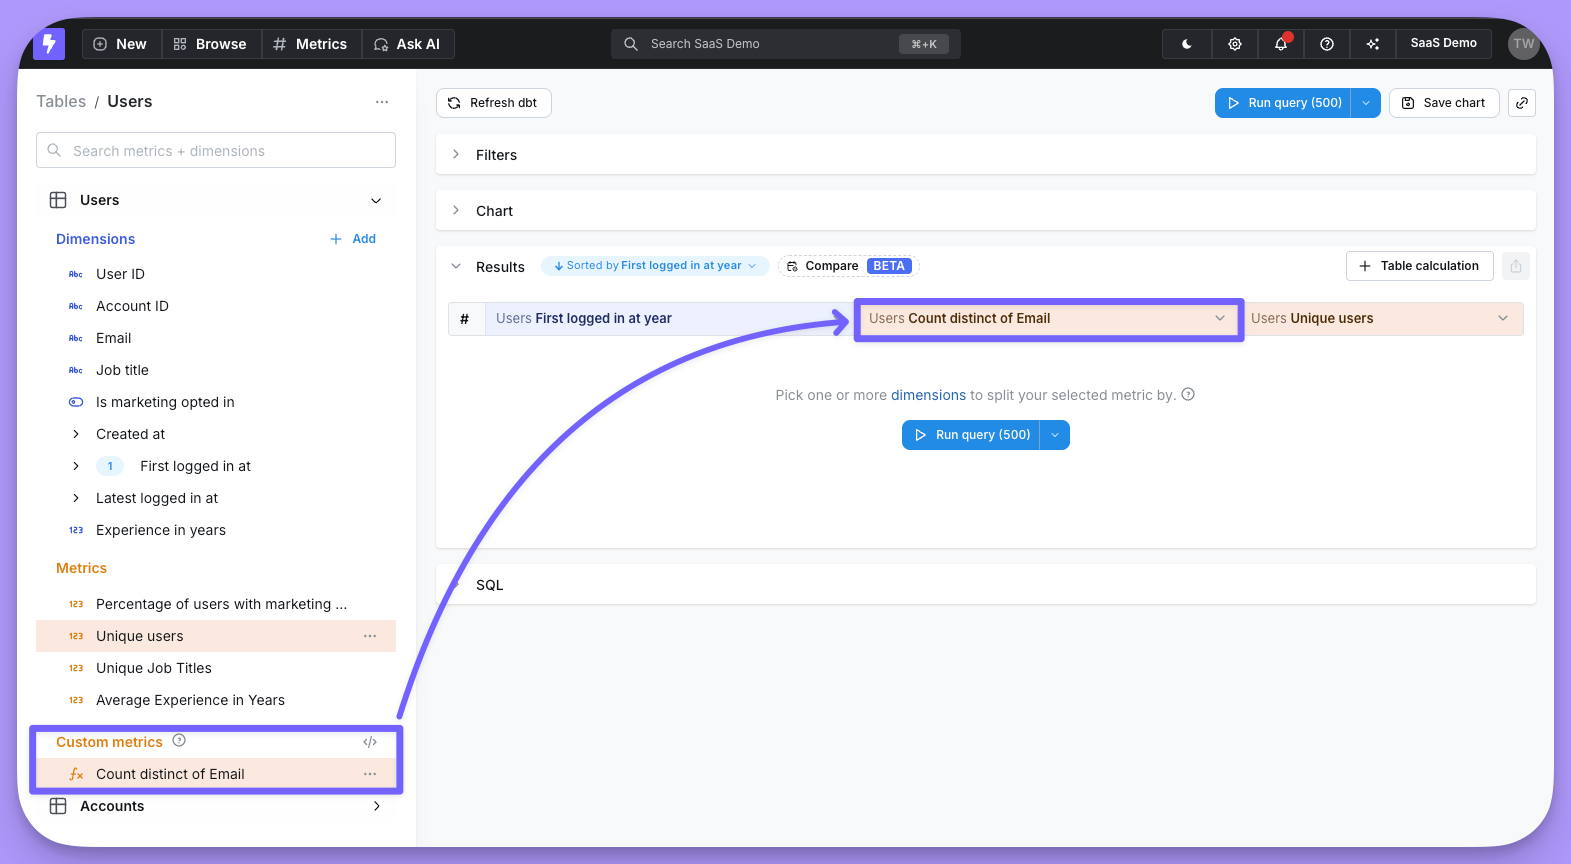
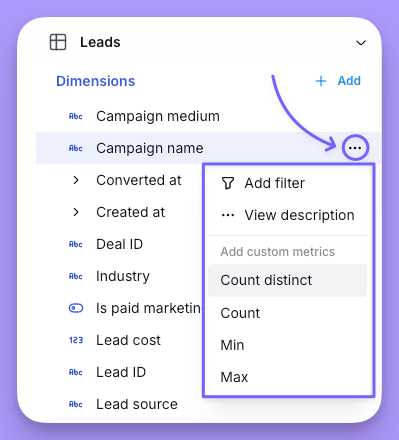 Then, your new metric will be added to your results table automatically and will appear in the `custom metrics` space in your sidebar.
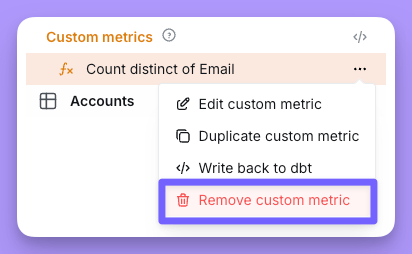
 If you want to delete the custom metric, you can just click on the three-dot `options` menu and hit `Remove custom metric`
 ### Custom metric types
To learn more about the custom metric types, read the [metrics reference documentation here](/references/metrics). Only aggregate metric types are available as custom metrics.
### Creating a custom metric from an existing metric
You can also start a custom metric from an existing YAML metric in the Explorer. This is useful when you want to reuse the base metric's SQL and settings but tweak one thing — most commonly, adding a filter to narrow the aggregation (for example, cloning `orders.total_revenue` and filtering it to a single product category).
To create a custom metric from an existing metric:
1. In the field tree sidebar or in the results table's column header menu, open the metric's three-dot `options` menu.
2. Click `Create custom metric`.
3. In the modal, edit the label, filters, and formatting, then click `Create`.
The clone starts with the same values as the base metric, so it returns the same numbers until you change something. Specifically, the following are copied from the base metric and are editable in the modal:
* The metric's `sql`, type (and `percentile`, where applicable).
* The base metric's YAML `filters`, as editable filter rules.
* The base metric's formatting (`formatOptions`, or legacy `format` / `round` / `compact` / `separator`, normalized to structured format options).
Clones of `min` / `max` metrics over `date` or `timestamp` columns inherit the base column's date or timestamp format automatically, and the numeric Format section is hidden for them.
The custom metric modal also displays the source metric (read-only) at the top so you can see where the clone came from when you edit it later.
**Which metrics can be cloned?**
Only aggregate metric types (`sum`, `count`, `count_distinct`, `min`, `max`, `average`, `median`, `percentile`) can be cloned into a custom metric. Non-aggregate and derived metric types — including `sum_distinct` and `average_distinct` — do not show the `Create custom metric` action.
**Defaults for filters you add**
When you add a new filter rule inside the modal, it defaults to the base metric's underlying column (its `dimensionReference`). This matters in explores that join tables with same-named columns (for example, an `amount` column on both `orders` and `payments`) — the filter targets the same table the base metric aggregates, rather than whichever `amount` column happens to appear first in the explore.
**Re-syncing clones with the base metric**
Custom metrics record their source metric internally, but they are not automatically re-synced when the base YAML metric changes. If the base metric is updated in dbt, edit the custom metric (or recreate it) to pick up the new definition.
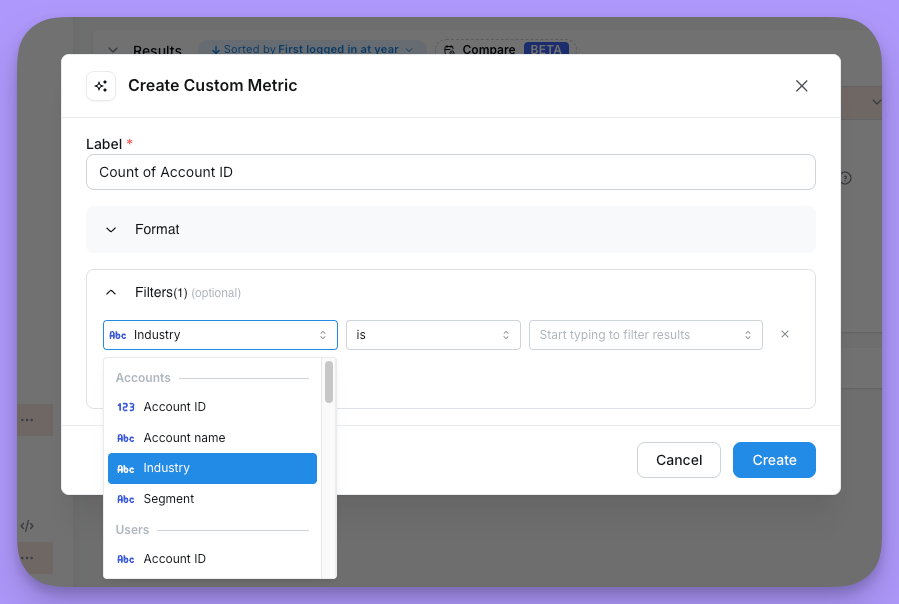
### Adding filters to your custom metric
You can add filters to limit the rows included in your metric aggregation. You can add filters when:
1. You create a custom metric:
### Custom metric types
To learn more about the custom metric types, read the [metrics reference documentation here](/references/metrics). Only aggregate metric types are available as custom metrics.
### Creating a custom metric from an existing metric
You can also start a custom metric from an existing YAML metric in the Explorer. This is useful when you want to reuse the base metric's SQL and settings but tweak one thing — most commonly, adding a filter to narrow the aggregation (for example, cloning `orders.total_revenue` and filtering it to a single product category).
To create a custom metric from an existing metric:
1. In the field tree sidebar or in the results table's column header menu, open the metric's three-dot `options` menu.
2. Click `Create custom metric`.
3. In the modal, edit the label, filters, and formatting, then click `Create`.
The clone starts with the same values as the base metric, so it returns the same numbers until you change something. Specifically, the following are copied from the base metric and are editable in the modal:
* The metric's `sql`, type (and `percentile`, where applicable).
* The base metric's YAML `filters`, as editable filter rules.
* The base metric's formatting (`formatOptions`, or legacy `format` / `round` / `compact` / `separator`, normalized to structured format options).
Clones of `min` / `max` metrics over `date` or `timestamp` columns inherit the base column's date or timestamp format automatically, and the numeric Format section is hidden for them.
The custom metric modal also displays the source metric (read-only) at the top so you can see where the clone came from when you edit it later.
**Which metrics can be cloned?**
Only aggregate metric types (`sum`, `count`, `count_distinct`, `min`, `max`, `average`, `median`, `percentile`) can be cloned into a custom metric. Non-aggregate and derived metric types — including `sum_distinct` and `average_distinct` — do not show the `Create custom metric` action.
**Defaults for filters you add**
When you add a new filter rule inside the modal, it defaults to the base metric's underlying column (its `dimensionReference`). This matters in explores that join tables with same-named columns (for example, an `amount` column on both `orders` and `payments`) — the filter targets the same table the base metric aggregates, rather than whichever `amount` column happens to appear first in the explore.
**Re-syncing clones with the base metric**
Custom metrics record their source metric internally, but they are not automatically re-synced when the base YAML metric changes. If the base metric is updated in dbt, edit the custom metric (or recreate it) to pick up the new definition.
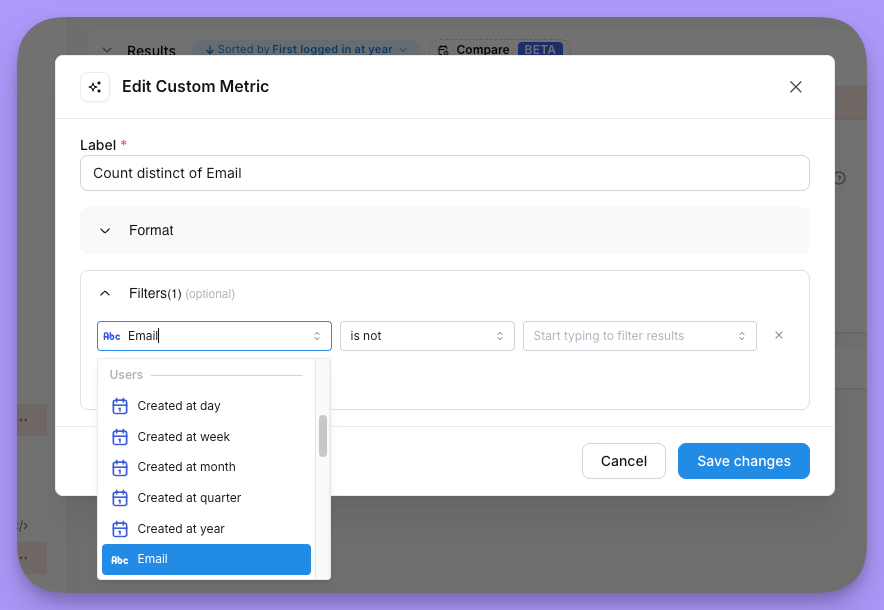
### Adding filters to your custom metric
You can add filters to limit the rows included in your metric aggregation. You can add filters when:
1. You create a custom metric:
 2. You edit an existing custom metric:
 ## Custom dimensions
Dimensions are used to group results in your query, or filter values from your results.
Sometimes, a group or filter that you need hasn't been added to your project, so you can use a custom dimension to create a grouping or filter on-the-fly.
These dimensions are not saved to the table permanently. They are only available in the saved chart or query that they were created in.
### Using custom dimensions in table calculations
You can reference custom dimensions in your table calculations without needing to qualify them with a table name. Simply use the custom dimension name directly in your calculation formula, just as you would with any other dimension.
### Bin
Bins are used to split out values of a numeric dimension into custom sets of ranges. Bins can only be used with dimensions that are numeric. Fixed bins (fixed number and fixed width) will update automatically if the min or max values of your dimension change.
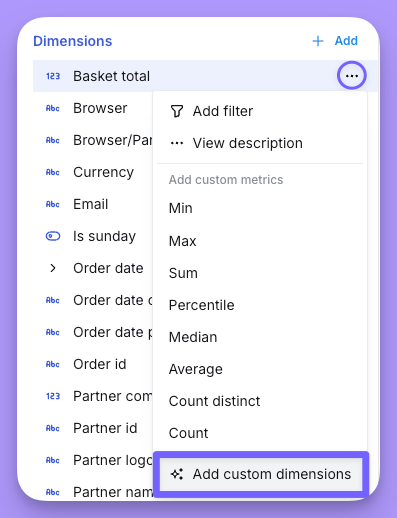
To create a bin custom dimension, you just need to:
1. Click on a dimension's three-dot `options` menu
2. Click on the `bin` option
3. Setup + create your dimension
## Custom dimensions
Dimensions are used to group results in your query, or filter values from your results.
Sometimes, a group or filter that you need hasn't been added to your project, so you can use a custom dimension to create a grouping or filter on-the-fly.
These dimensions are not saved to the table permanently. They are only available in the saved chart or query that they were created in.
### Using custom dimensions in table calculations
You can reference custom dimensions in your table calculations without needing to qualify them with a table name. Simply use the custom dimension name directly in your calculation formula, just as you would with any other dimension.
### Bin
Bins are used to split out values of a numeric dimension into custom sets of ranges. Bins can only be used with dimensions that are numeric. Fixed bins (fixed number and fixed width) will update automatically if the min or max values of your dimension change.
To create a bin custom dimension, you just need to:
1. Click on a dimension's three-dot `options` menu
2. Click on the `bin` option
3. Setup + create your dimension
 Then, your new dimension will be added to your results table automatically and will appear in the `custom dimensions` space in your sidebar.
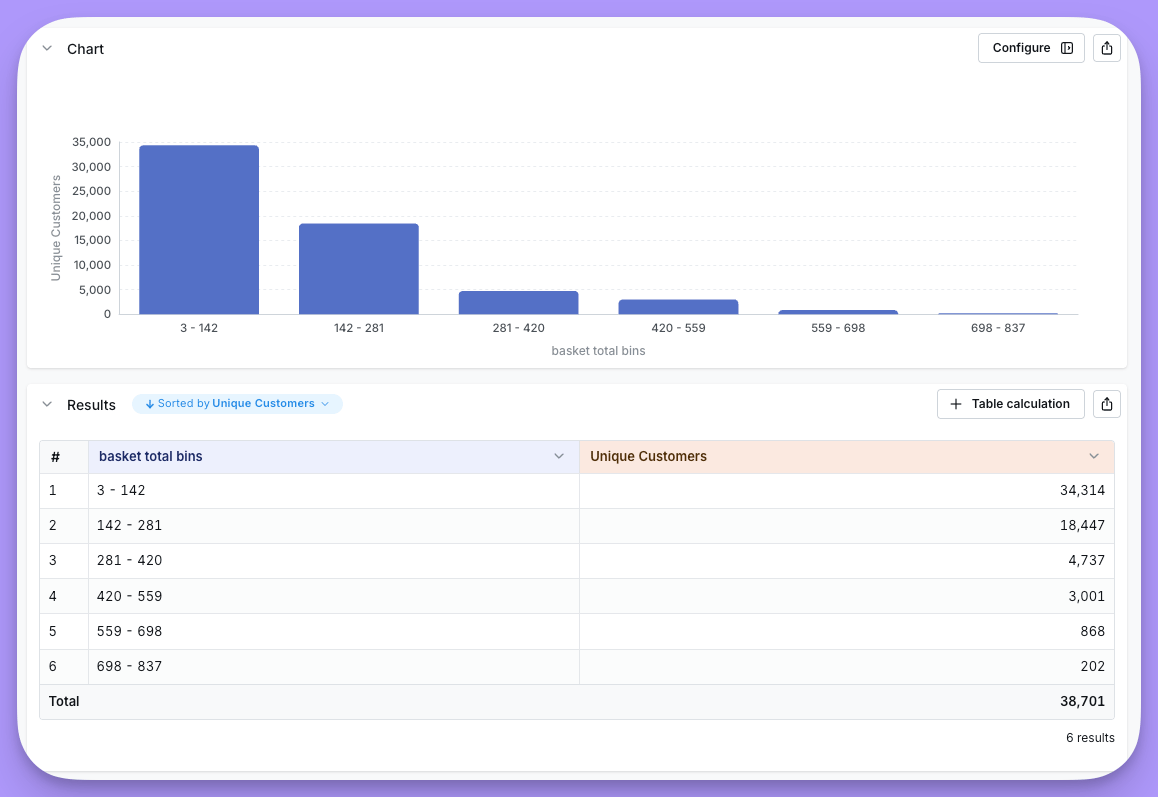 There are three ways that you can set up your bins:
**1. Fixed number of bins**
You pick the number of bins that you want to group your dimension into and Lightdash automatically defines the ranges for your bins. The ranges that Lightdash generates for the bins are equal to the range of the values in your dimension divided by the number of bins you selected.
**2. Fixed width**
You pick the width (a.k.a. ranges) for your bins and Lightdash automatically defines a set of bins with those widths. The number of bins that Lightdash generates is equal to the range of values in your dimension divided by the fixed width that you picked for your bins.
**3. Custom range**
You manually define the min and max values for each bin. The custom range option is the only binning option that will not automatically update if the min or max values of your dimension change (you would need to manually adjust your custom bins or some values could not be included in your bins).
### Custom SQL
Custom SQL dimensions let you pull in new data directly from your database, which means they can sometimes be used to bypass access restrictions. **Only users with admin or developer permissions can create custom SQL dimensions** — or, on Enterprise plans, any user assigned a [custom role](/references/workspace/custom-roles) that includes the **Manage Custom Fields** scope (*Create and edit custom dimensions*). Other users will not see authoring options for custom SQL dimensions, but can still use existing ones in their queries.
**Security note:**\
Custom SQL dimensions can query any data from your warehouse, so they should only be created by trusted users (admins and developers). For most cases, it's safer and more reusable to define dimensions in your dbt files. If you want to make a custom SQL dimension reusable, use the [dbt write-back](https://docs.lightdash.com/references/dbt-write-back#dbt-write-back) feature to move it into your dbt project.
#### When to use custom SQL dimensions
* **Quickly create new groupings or calculations** that aren't yet available in your project.
* **Reference other dimensions** from the main table and joined tables in your explore.
* **Prototype new logic** before moving it to your dbt project.
#### When *not* to use custom SQL dimensions
* If you need the dimension to be **reusable** or **governed** for your whole team.
* If you want to ensure **consistent access control** and security.
#### Example: Categorizing order totals
In this example, let's explore the `orders` table and create a custom dimension that categorizes my orders' totals into three categories: `low`, `medium`, and `high`.
You can click on the button to add a custom dimension on the sidebar:
There are three ways that you can set up your bins:
**1. Fixed number of bins**
You pick the number of bins that you want to group your dimension into and Lightdash automatically defines the ranges for your bins. The ranges that Lightdash generates for the bins are equal to the range of the values in your dimension divided by the number of bins you selected.
**2. Fixed width**
You pick the width (a.k.a. ranges) for your bins and Lightdash automatically defines a set of bins with those widths. The number of bins that Lightdash generates is equal to the range of values in your dimension divided by the fixed width that you picked for your bins.
**3. Custom range**
You manually define the min and max values for each bin. The custom range option is the only binning option that will not automatically update if the min or max values of your dimension change (you would need to manually adjust your custom bins or some values could not be included in your bins).
### Custom SQL
Custom SQL dimensions let you pull in new data directly from your database, which means they can sometimes be used to bypass access restrictions. **Only users with admin or developer permissions can create custom SQL dimensions** — or, on Enterprise plans, any user assigned a [custom role](/references/workspace/custom-roles) that includes the **Manage Custom Fields** scope (*Create and edit custom dimensions*). Other users will not see authoring options for custom SQL dimensions, but can still use existing ones in their queries.
**Security note:**\
Custom SQL dimensions can query any data from your warehouse, so they should only be created by trusted users (admins and developers). For most cases, it's safer and more reusable to define dimensions in your dbt files. If you want to make a custom SQL dimension reusable, use the [dbt write-back](https://docs.lightdash.com/references/dbt-write-back#dbt-write-back) feature to move it into your dbt project.
#### When to use custom SQL dimensions
* **Quickly create new groupings or calculations** that aren't yet available in your project.
* **Reference other dimensions** from the main table and joined tables in your explore.
* **Prototype new logic** before moving it to your dbt project.
#### When *not* to use custom SQL dimensions
* If you need the dimension to be **reusable** or **governed** for your whole team.
* If you want to ensure **consistent access control** and security.
#### Example: Categorizing order totals
In this example, let's explore the `orders` table and create a custom dimension that categorizes my orders' totals into three categories: `low`, `medium`, and `high`.
You can click on the button to add a custom dimension on the sidebar:
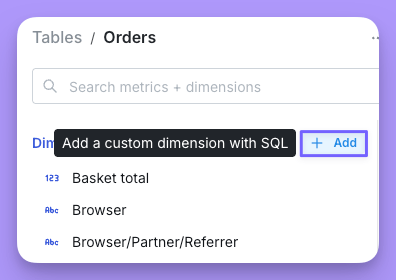 Then you can write your SQL query to create your custom dimension:
```sql theme={null}
CASE
WHEN ${orders.subtotal} < 100 THEN 'low'
WHEN ${orders.subtotal} < 500 THEN 'medium'
ELSE 'high'
END
```
Then you can write your SQL query to create your custom dimension:
```sql theme={null}
CASE
WHEN ${orders.subtotal} < 100 THEN 'low'
WHEN ${orders.subtotal} < 500 THEN 'medium'
ELSE 'high'
END
```
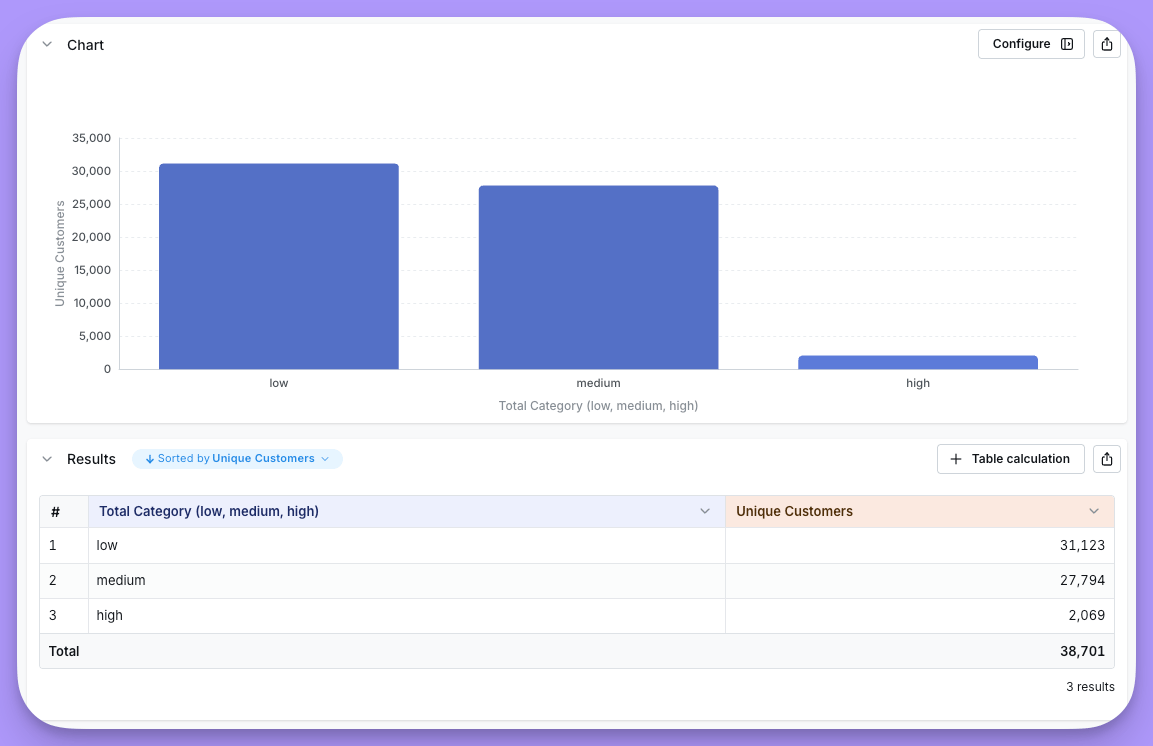
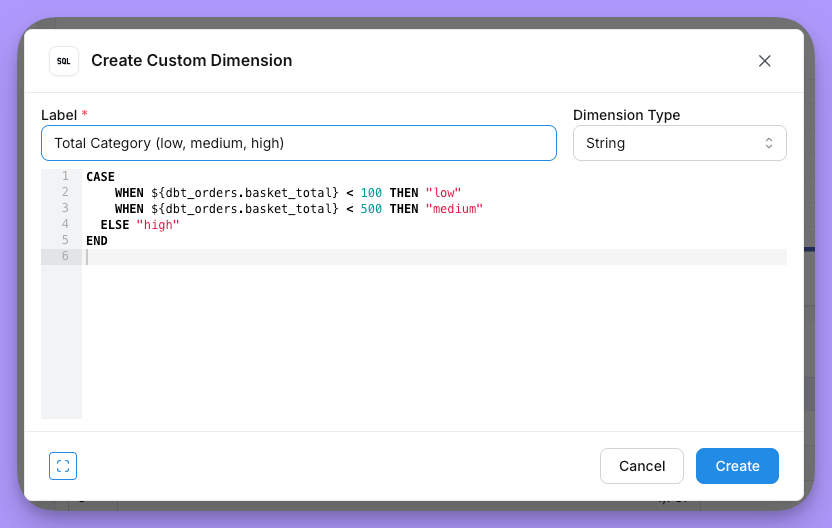 And after you run your query, you will see your new custom dimension categorising your orders' totals: